Viewing & Analyzing Logs
At its core, LogViewer is designed to give you high-speed visibility into complex Android logs while preserving full chronological context.
Loading Logs
You can load logs into LogViewer through any of the following methods:
- Drag and Drop: Drag one or more
.txt,.log, or.zipbugreport files directly into the LogViewer window. - File Menu: Go to
Logs > Open Logsor press Cmd+O (macOS) / Ctrl+O (Linux & Windows). - Command Line: Pass log paths when launching from your terminal:
The Synchronized Dual-Pane View
When logs and filters are active, LogViewer divides the workspace into two synchronized log tables:
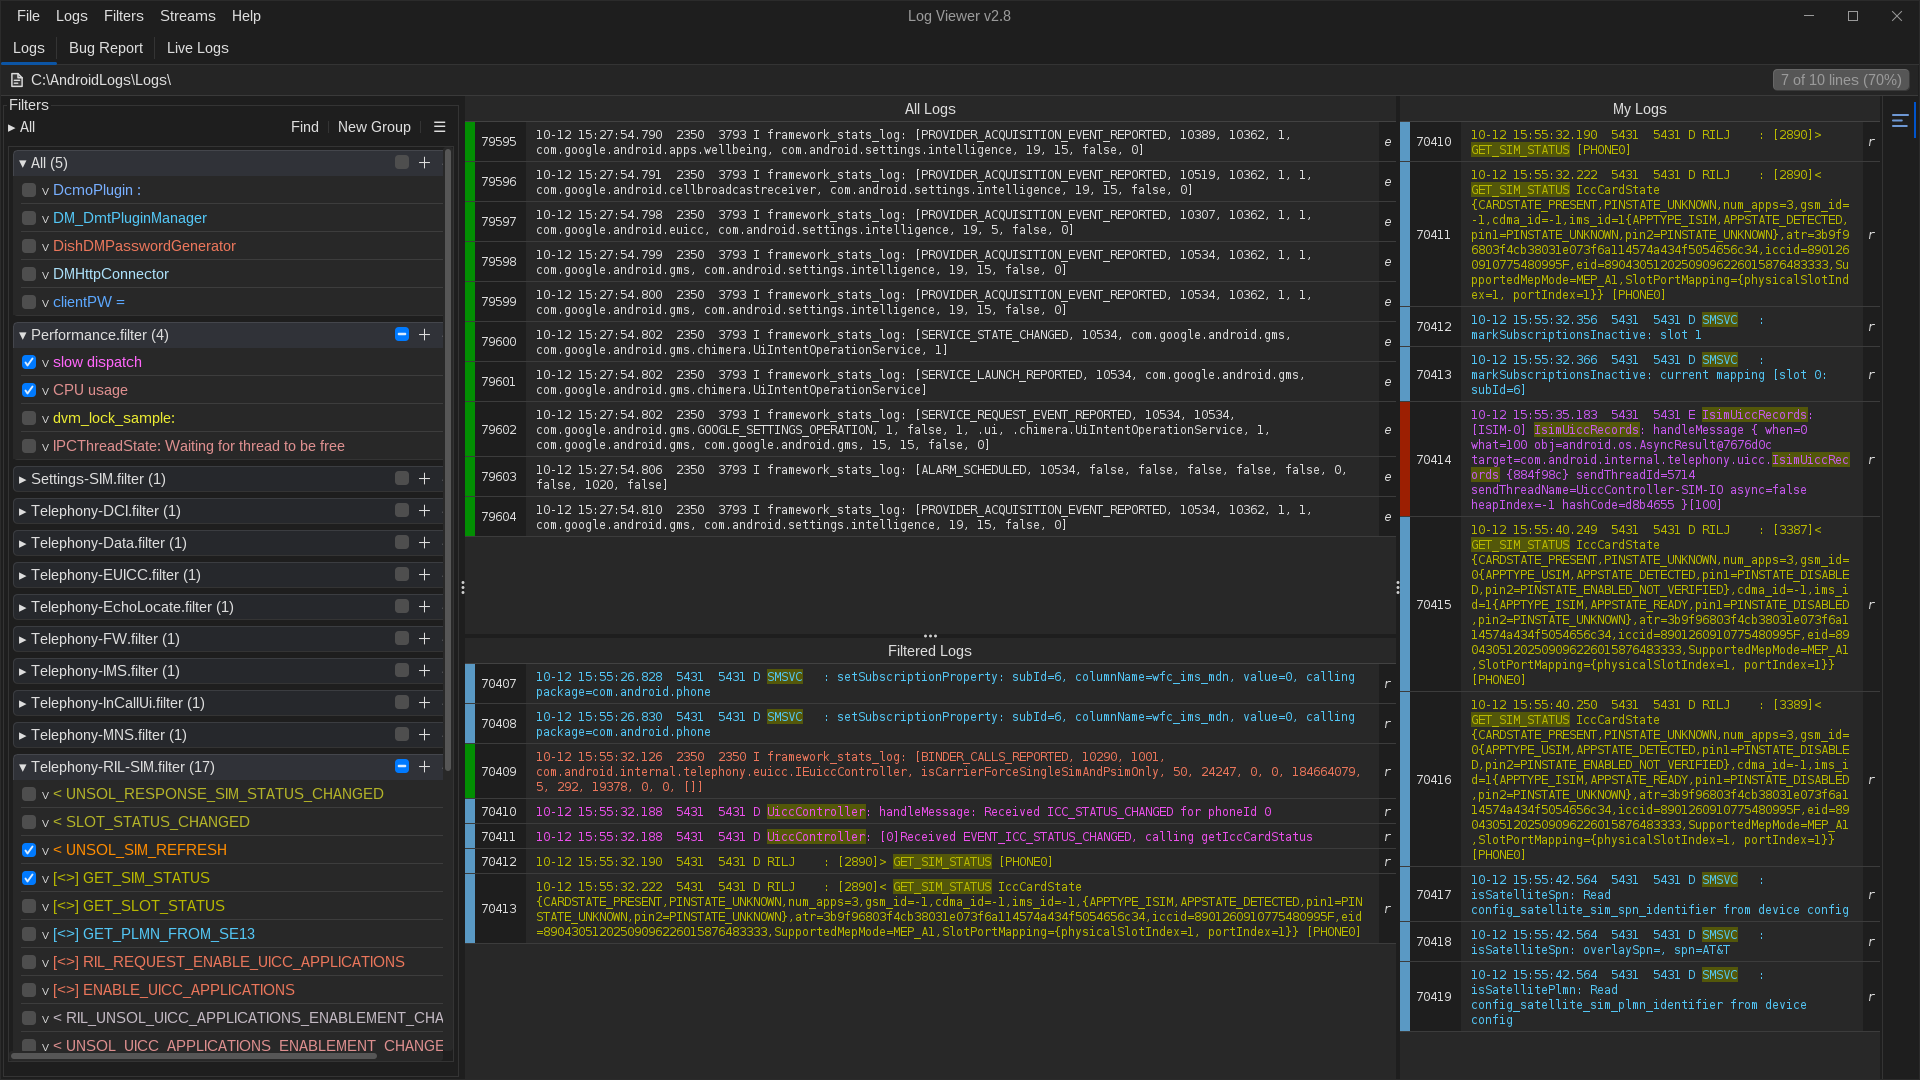
- All Logs View (Top/Left): Displays every raw log entry loaded across all files and streams in chronological order.
- Filtered Logs View (Bottom/Right): Displays only the log lines that match your active filters, color-coded by filter rule.
Context Preservation
When triaging an issue, seeing isolated filter matches alone can cause you to miss what the system was doing immediately before or after a crash.
Whenever you click a line in the Filtered Logs view, LogViewer instantly scrolls to and highlights that exact log line in the All Logs view, allowing you to seamlessly inspect surrounding system activity.
In-Table Search
Every log table includes a high-performance, debounced in-table search engine:
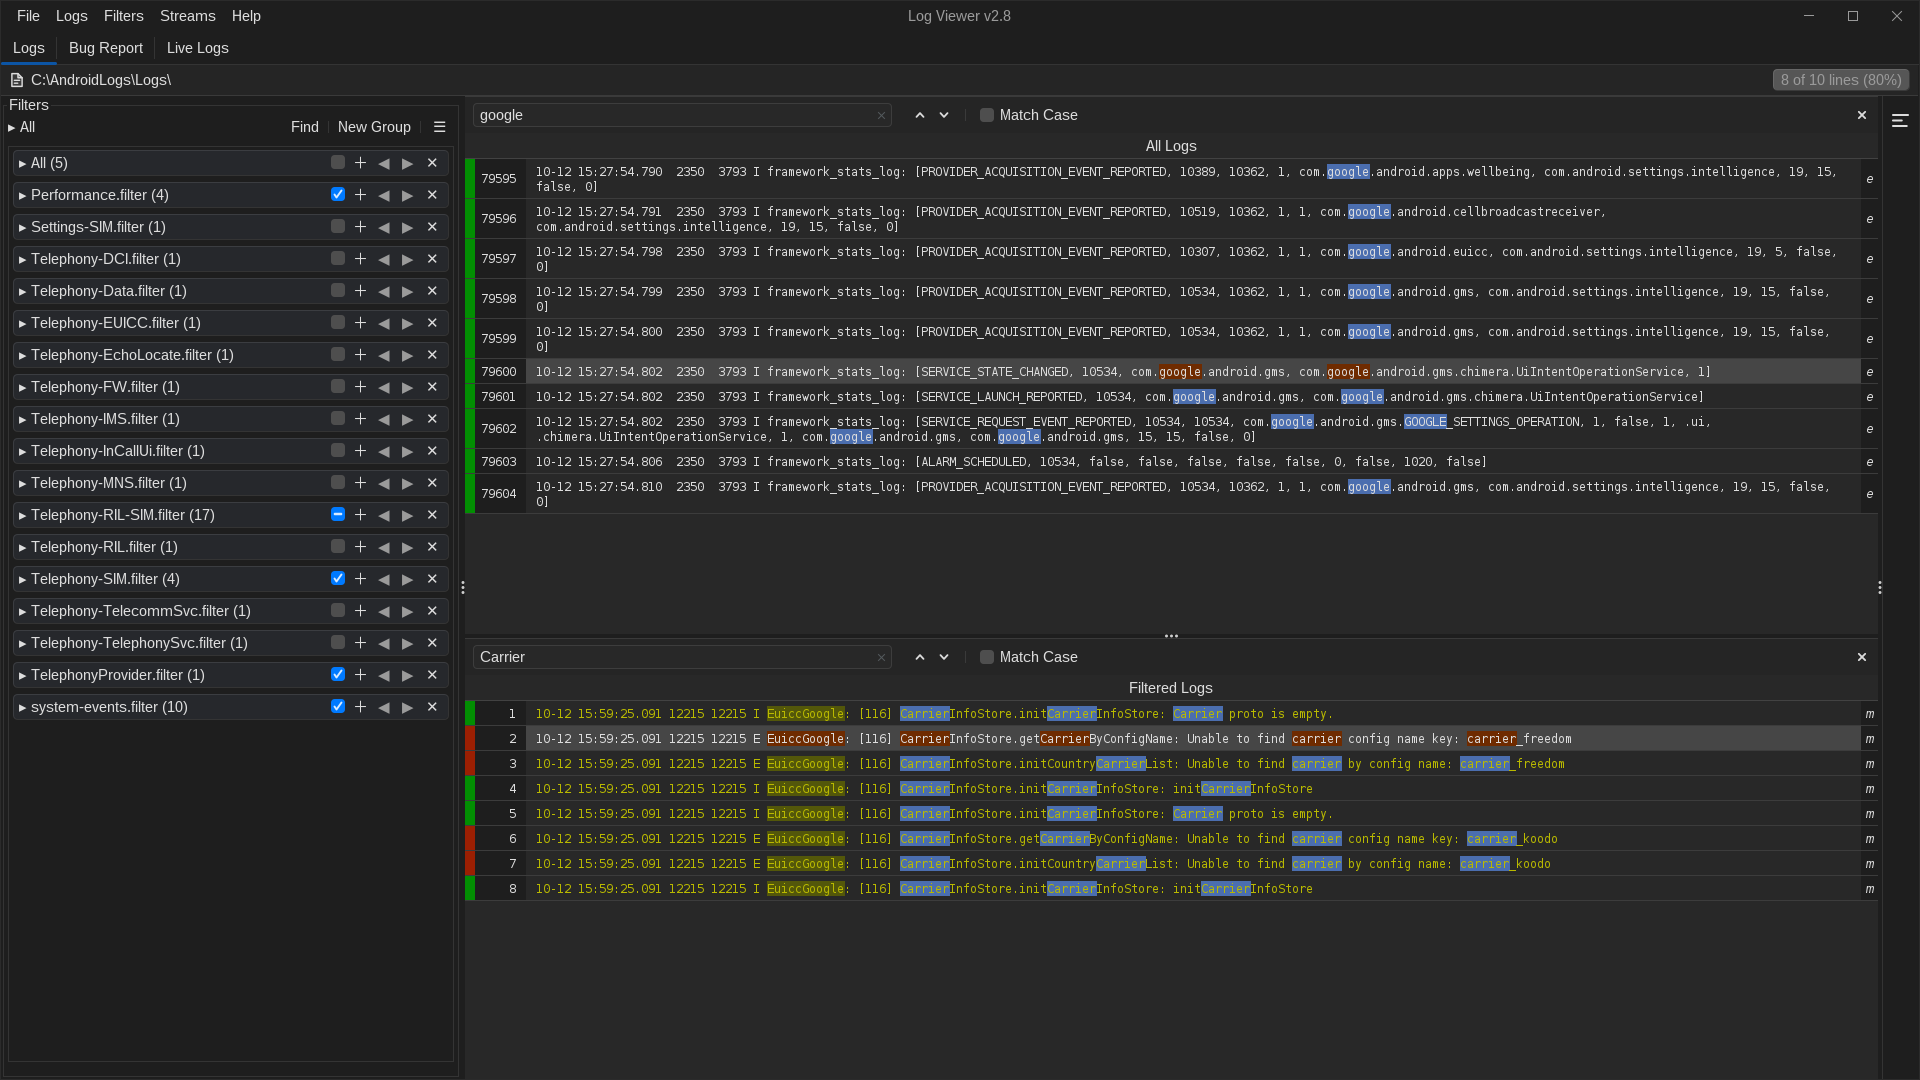
- Open Search: Press Cmd+F (macOS) or Ctrl+F (Linux & Windows) while focused on any log table.
- Type to Filter: Search terms are evaluated in real time without freezing the UI.
- Forward Navigation: Press Enter or F3 to jump to the next matching line.
- Reverse Navigation: Press Shift+Enter or Shift+F3 to jump backward to the previous match.
- Match Statistics: The search bar indicates current position and total matches found (
x of y). - Dismiss: Press Esc to close the search bar and return focus to the log table.
Detailed Line Inspector
Log entries such as Java crash traces, Binder dumps, or JSON payloads often contain long multiline messages that get truncated in a single-row table.
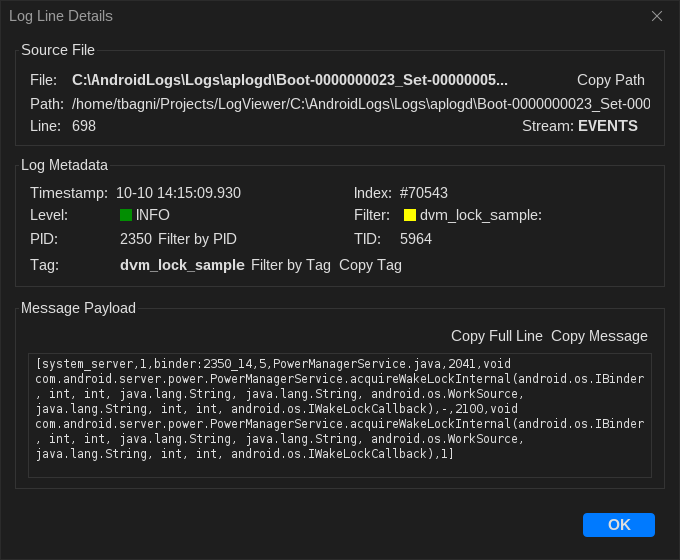
- Press Cmd+I (macOS) / Ctrl+I (Linux & Windows) or right-click and choose Inspect.
- The inspector dialog presents a formatted breakdown of the selected log entry:
- Timestamp: Millisecond-accurate event time.
- Priority: Verbose, Debug, Info, Warning, Error, or Assert.
- Tag: Originating logging component or class.
- PID & TID: Originating Process ID and Thread ID.
- Message: Full, word-wrapped multiline message text with one-click copy.
Context Menu & Quick Actions
Right-clicking on any log line provides instant contextual actions:
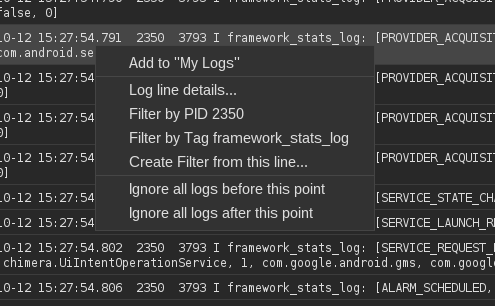
- Filter by PID / Filter by Tag: Automatically generates and applies a new filter for the selected log line's process ID or tag, instantly isolating all logs emitted by that specific process or component.
- Create Filter from this line...: Opens the Filter Editor pre-filled with the selected line's text and tags.
- Add to My Logs: Pins the log entry into the My Logs bookmark list.
- Inspect Line: Opens the detailed inspector dialog.
- Copy: Copies the selected log line(s) to your clipboard.
- Ignore Logs Before / After: Sets active Time Window boundaries.
Measuring Elapsed Time Between Log Lines
When investigating performance bottlenecks, ANRs, or slow startup sequences, you can measure the exact time delta between any two log entries:
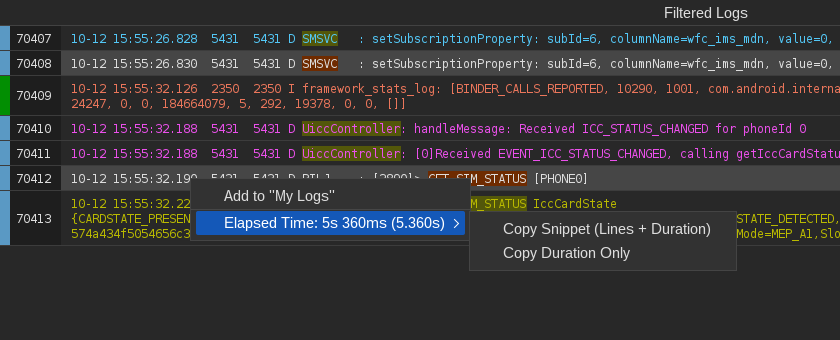
- Select any two log lines in All Logs, Filtered Logs, or My Logs (using Cmd / Ctrl + click, or Shift + click for adjacent lines).
- Right-click to immediately see the calculated Elapsed Time between the two timestamps in the context menu.
- Hover over Elapsed Time to copy the result to your clipboard:
- Copy Snippet (Lines + Duration): Copies both log lines along with the formatted elapsed time delta—ideal for pasting directly into bug reports, pull requests, or issue tickets.
- Copy Duration Only: Copies just the formatted duration string (e.g.,
5s 360ms (5.360s)).