Live Logcat Streaming
LogViewer includes a native Android Debug Bridge (ADB) engine that lets you stream live device logs directly into your workspace. It provides automatic device detection, buffer selection, real-time color filtering, and device shell access without needing command-line setup.
The Device Hub
When you switch to the Live Logs tab, LogViewer scans for all attached Android devices (both physical hardware connected via USB and emulated or Wi-Fi devices).
The Device Hub displays:
* Device Name & Serial Number: Identifies each device model and hardware serial.
* Connection Status: Indicates whether the device is Online, Unauthorized (prompting you to accept the USB debugging dialog on the device screen), or Offline.
* One-Click Actions:
* Start: Begins live logcat streaming from the selected device.
* Terminal: Opens your native OS terminal with a direct interactive root/user shell session (adb -s <serial> shell).
* Header Controls:
* Refresh: Rescans for newly connected devices.
* Restart Server: Kills and restarts the local adb daemon if connection issues occur.
Logcat Stream Buffers
Android separates log output into distinct internal ring buffers. Before or during streaming, you can select which buffers you want to capture:
| Buffer | Description |
|---|---|
main |
Main application log buffer (standard log output). |
system |
System server and framework services messages. |
events |
High-level diagnostic and window manager events. |
crash |
Native crash dumps and uncaught exception traces. |
radio |
Telephony, cellular modem, and RIL communications. |
kernel |
Low-level kernel logs (dmesg / /dev/kmsg, when supported). |
Streaming Controls & Real-Time Triage
While streaming is active, LogViewer provides an interactive control bar:
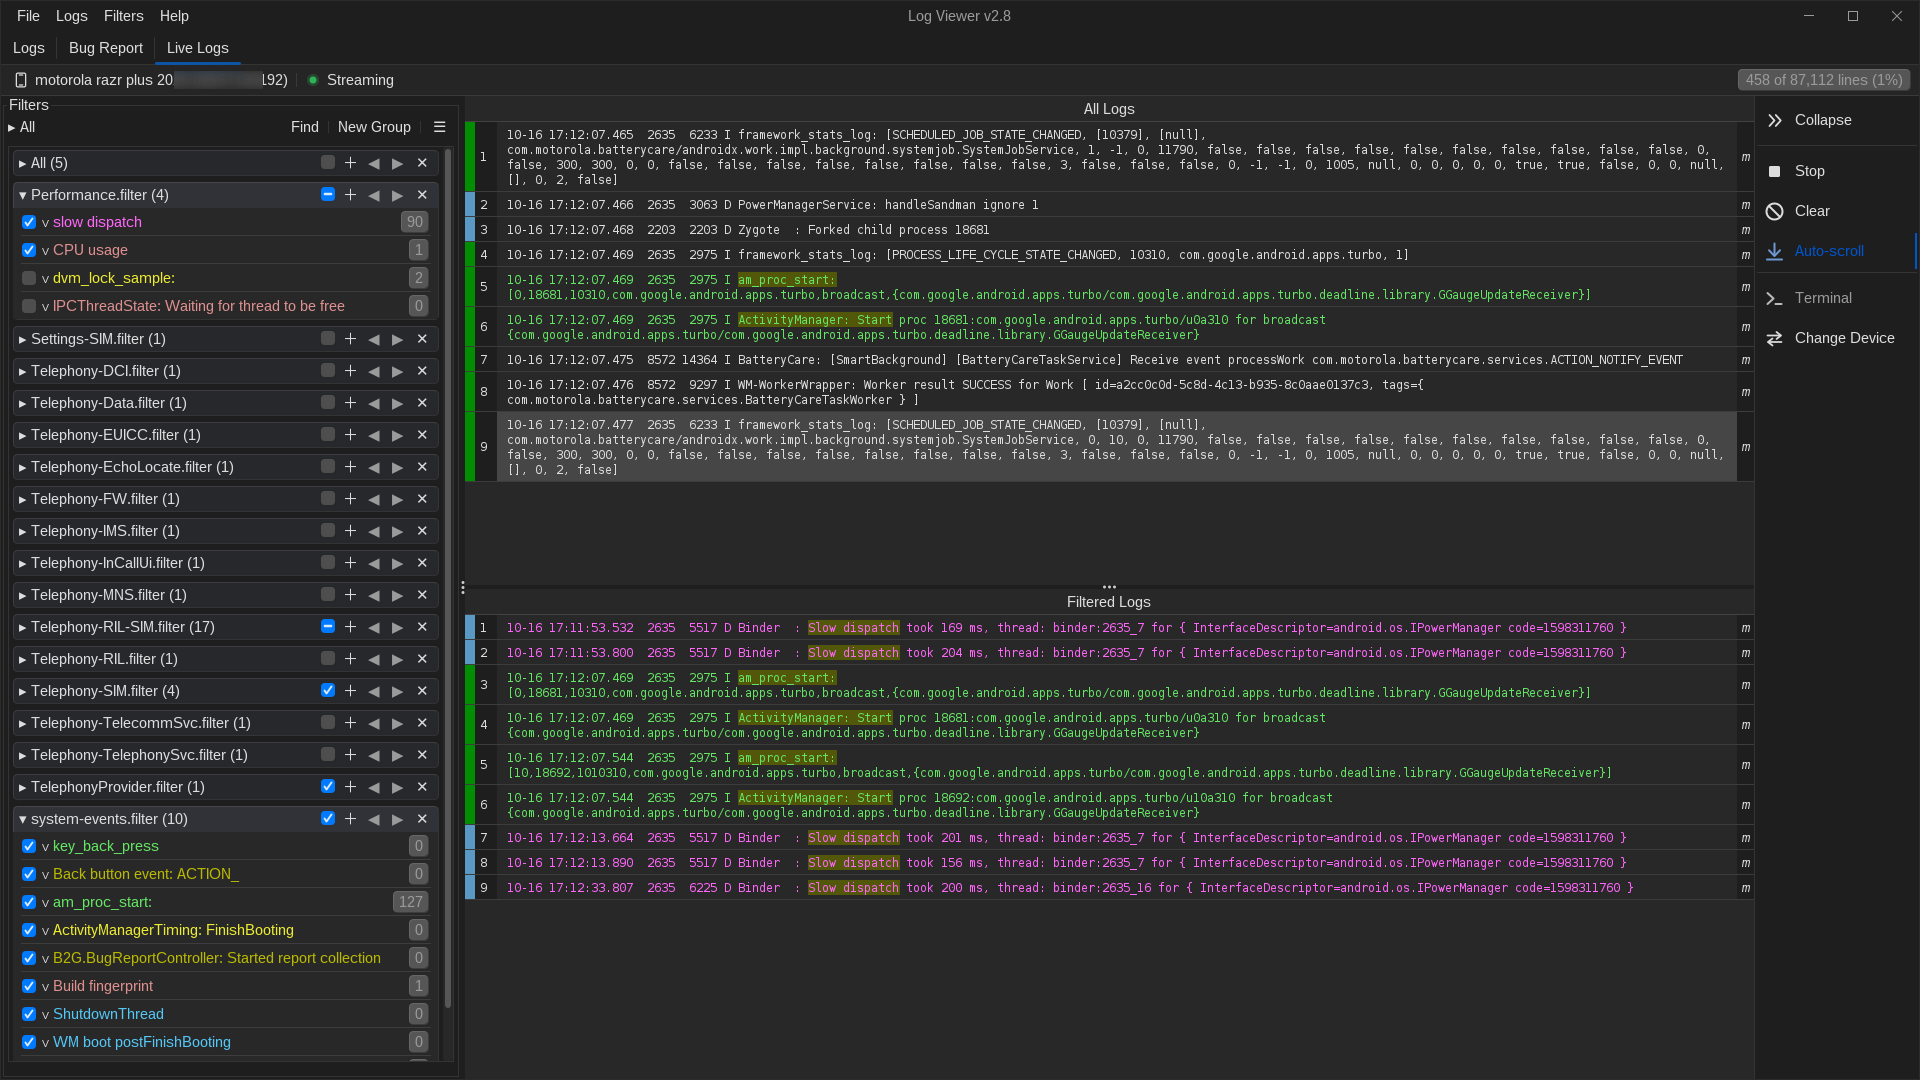
- Auto-Scroll: Automatically scrolls to the bottom as new log lines arrive. If you manually scroll up to inspect an earlier line, auto-scroll pauses automatically so you don't lose your place. Toggling Auto-Scroll back on resumes tracking the live tail.
- Real-Time Color Filtering: As logs stream in at thousands of lines per second, your active filters are applied in real time. Matching lines appear instantly in the Filtered Logs pane with their designated colors.
- Drop / Throughput Indicators: The status bar monitors live line throughput and dropped log events to ensure your stream is completely lossless.
- Terminal: Launches an external shell session to run commands on the device while watching log reactions live.
- Clear: Clears the current buffer.
- Stop: Pauses the live capture while leaving all captured logs intact for continued filtering, searching, and export.
- Change Device: Returns to the Device Hub to switch to a different target device.
Context Actions on Live Lines
Right-clicking any live log line provides quick actions: * Filter by PID: Instantly creates and applies a filter for the selected process ID. * Inspect Line: Opens a detailed inspector popup showing the raw timestamp, tag, priority level, PID/TID, and message body. * Add to My Logs: Bookmarks the line for later reference. * Copy: Copies the log line or message text to your clipboard.